Europe's satellite service adds wildfire tracking layer built on a 2015 script
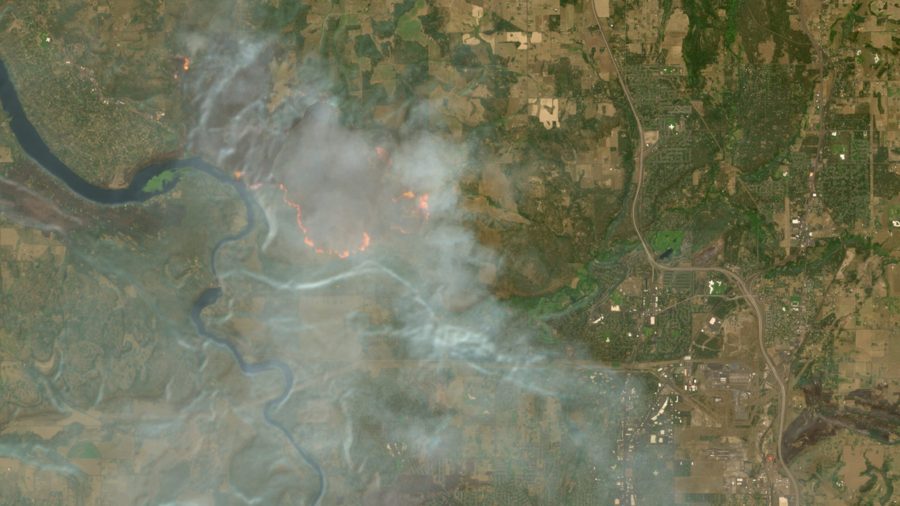
The Copernicus Browser, Europe's free satellite imagery service, has introduced a dedicated visualization layer for wildfire monitoring. The feature, launched on August 4, lets users see active fire fronts, scorched vegetation, and burned ground using multispectral data from the Sentinel-2 mission.
The new layer is powered by a JavaScript script written by remote sensing expert Pierre Markuse nearly a decade ago. His algorithm merges three spectral bands: red visible light, a narrow near-infrared channel that distinguishes healthy from damaged vegetation, and short-wave infrared 2, which reveals soil moisture levels. This combination renders active fires in white or yellow, burning vegetation in red, and burned landscapes in dark brown or black.
Copernicus Browser draws on imagery from the European Space Agency's three Sentinel-2 satellites, which capture multispectral data at resolutions as fine as 10 meters in visible and near-infrared bands. The service previously offered ten default visualization layers with different spectral band combinations, but none were tailored specifically to fires.
The new tool makes it easier for researchers, volunteers, and local communities to assess fire extent and ecosystem damage without manually configuring band combinations. The layer comes from adapting Markuse's long-standing script, which had already been used in other satellite image processing tools.